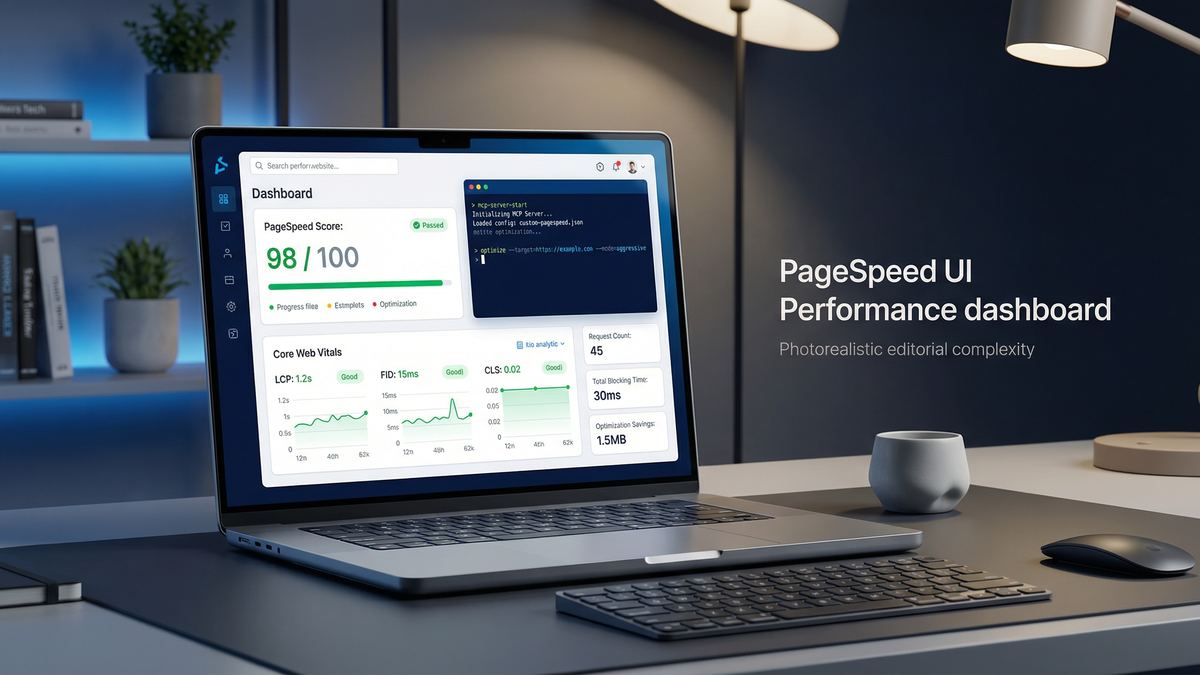
Performance analysis is no longer an information problem. The data exists, Lighthouse exists, Google PageSpeed Insights exists, and Chrome DevTools has been there all along. The real issue is the workflow in between. That is where things become noisy in practice: check a URL in the browser, read the values, note the opportunities, explain them again to Claude, switch back to DevTools, and then finally look for the actual cause in the code. That works for a single page. It is inefficient for repeatable technical work.
That is why I built my own PageSpeed Insights MCP. The idea was straightforward: if I am already working with Claude, Codex and Chrome DevTools, then I want the audit data available as tools inside that workflow instead of collecting it manually every time. Once you do that, a fragmented analysis process turns into something reproducible.
Demo: The video shows the MCP in action with Claude, including the audit call, score interpretation and the handoff into technical analysis.
Why I built this MCP in the first place
What bothered me most was the context switching. A score inside the PageSpeed interface is easy to read, but that does not solve the actual problem. The important questions start after that: which audits are dragging the result down, are they based on real field data or only lab metrics, is mobile weak while desktop looks fine, and which fixes are actually worth doing first?
Before the MCP, the process usually looked like this:
- paste the URL into Google PageSpeed Insights
- read scores and opportunities manually
- copy the relevant findings into chat or notes
- open Chrome DevTools if deeper analysis is needed
- inspect the loading path there
- decide whether the root cause is markup, images, JavaScript or server-side behavior
That process is not only slow, it also creates friction. Every manual transfer of values is another point where context gets flattened or lost. I wanted the analysis to happen in the same place where decisions are made: inside the agent workflow.
What my PageSpeed Insights MCP actually does
The MCP sits on top of the official Google API and exposes the analysis as tools. At the moment, the core feature set is built around four functions:
run_pagespeed_auditcompare_pagespeed_strategiesbatch_pagespeed_auditget_pagespeed_audit_details
That covers the cases I actually care about in day-to-day work. I can run a single audit, compare multiple URLs, inspect mobile and desktop side by side, or request only the problematic audit details instead of wading through a full response dump.
Just as important, I did not want a tool that merely forwards raw JSON. The output needs to be usable by a model and readable by a human. I do not just want to know that a page sits at SEO 92 and Best Practices 96. I want to know why. That second layer is what makes the tool useful in a real AI-assisted workflow.
Mobile by default, but without losing flexibility
One design choice mattered more than it might seem: mobile should stay the default. In most real projects, that is the stricter and more realistic perspective. At the same time, I did not want to lose flexibility, which is why the MCP supports mobile, desktop and both.
That sounds like a small implementation detail, but it matters in practice. If I just want a quick signal after a change, a mobile run is often enough. If I need to understand why the experience diverges across devices, both is the more useful mode. That is where sensible defaults and a rigid tool stop being the same thing.
What data comes back and why that matters
A single score is a nice indicator, but not a technical finding. That is why the MCP does not stop at the category scores for Performance, Accessibility, Best Practices and SEO. It also pulls the layers underneath:
- Lighthouse category scores
- CrUX field data such as LCP, INP, CLS, FCP and TTFB
- Lighthouse lab metrics
- opportunities with estimated savings
- failed or suspicious audits
That is the difference between saying “the page is slow” and saying “the page is losing points mainly because of render blocking, response time, image weight or unnecessary main-thread work.” Only once that layer is visible does prioritization become sensible.
Why Claude plus Chrome DevTools makes this much stronger
PageSpeed tells me very quickly that a problem exists. Chrome DevTools helps me understand why it exists. Claude becomes the layer that turns those findings into structured reasoning.
My workflow now usually looks like this:
- Claude receives a URL and calls the PageSpeed tool.
- The MCP returns scores, CrUX values and prioritized opportunities.
- Claude evaluates which findings actually matter.
- If deeper investigation is needed, the next step moves directly into Chrome DevTools.
- There I inspect the critical path, requests, rendering behavior or the actual LCP element.
- The result is a concrete list of actions instead of a vague diagnosis.
That connection between audit, interpretation and root-cause analysis is the real reason I built this as a proper MCP server instead of a throwaway script.
The technical architecture behind it
The plugin itself runs locally as an MCP server over stdio. I set it up as a Codex plugin, defined clear tool schemas and shaped the outputs so that Claude and other MCP-capable clients can work with them without extra translation.
The architecture is deliberately pragmatic:
- a local Node-based MCP server
- the official Google PageSpeed Insights API as the source
- strict input validation
- readable, structured summaries
- an additional bridge to the Chrome DevTools MCP
I was not trying to build a huge monitoring platform. The point was to create a tool that is immediately useful in everyday work: check a URL, prioritize the problem, isolate the cause and implement the fix.
What this improves in real work
Since the PageSpeed Insights MCP has been in place, a lot of common performance tasks have become noticeably more direct. I can validate a landing page before launch, compare mobile against desktop after a redesign or batch-check problematic URLs very quickly. More importantly, I no longer have to keep translating between browser output, audit tools and chat.
That sounds modest, but it is exactly where productivity comes from. Technical workflows rarely fail because information is missing. They fail because the information lives in too many disconnected tools. A good MCP closes that gap.
Why I prefer building tools like this myself
The real appeal of MCPs, at least for me, is not just integration. It is control over the workflow. I can choose defaults that actually fit how I work. I can structure the output so that it is genuinely useful for agents. And I can combine multiple tools into a process instead of leaving them as isolated data sources.
That is especially valuable in performance work. A tool that only spits out scores is less helpful than a tool that prepares context and next steps. That is why the combination of PageSpeed Insights, Claude and Chrome DevTools mattered to me much more than any especially polished interface.
Conclusion
I built this PageSpeed Insights MCP because I was tired of fragmented audits. I did not want to keep jumping between a browser tab, a Lighthouse report, DevTools and chat. I wanted a clear technical workflow where the data, the analysis and the next steps all live in the same system.
That is the real value of a good MCP: not just an API wrapper, but an operational interface between diagnosis and implementation. Once you work heavily with AI assistants, that difference becomes obvious very quickly. The audit stops being a report and starts becoming a usable work unit.
The bugs shown in the video were of course fixed right away with Codex.